In response to this thread on the ConnectWise University forums, asking how CW partners track projected resource utilization and workforce management, I decided it would be helpful to the partner community to share how we’ve set about accomplishing this feat.
As I mentioned on the thread, we have built a web application that allows our PMs and our consultants to record their project hours against assigned projects. The system pulls project assignments from CW and prompts people to enter their forecasted hours for the next 12 weeks on a project-by-project basis. The data is stored in a SQL table that allows us to do a variety of reporting, as I’ll outline below.
So here’s how the system works:
-
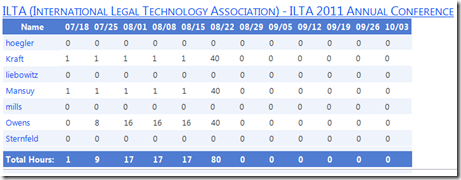
- Leveraging IntApp Integration Builder, every Tuesday morning at 9am two sets of e-mails get sent out:
-
- Every billable consultant receives a similar e-mail where the rows are the individual projects to which the consultant is assigned.
The numbers in the grid are the cumulative time that has been scheduled for that consultant/project/week.
- Every billable consultant receives a similar e-mail where the rows are the individual projects to which the consultant is assigned.
- Leveraging IntApp Integration Builder, every Tuesday morning at 9am two sets of e-mails get sent out:
-
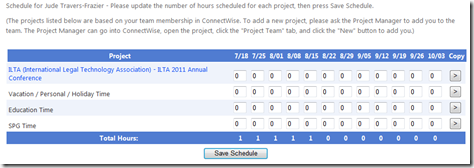
- In response to each e-mail (some people may receive multiple e-mails, since some people PM multiple projects), the recipient is required to access the intranet and update/confirm the hours entered per project/per week. Similar to the e-mails, there are two different screens: one for each project for the PM showing all members assigned to that project; another for each individual showing all of their projects.
-
- The next screenshot shows an individual’s page. It contains the one project to which he has been assigned, plus several additional rows for certain non-project activity types that we want people to be able to forecast time against.
-
- In response to each e-mail (some people may receive multiple e-mails, since some people PM multiple projects), the recipient is required to access the intranet and update/confirm the hours entered per project/per week. Similar to the e-mails, there are two different screens: one for each project for the PM showing all members assigned to that project; another for each individual showing all of their projects.
From there, the world is pretty much our oyster. We can report on basically anything of which you can conceive. We have:
-
- An availabilty “heat map” (similar to the CW Service Dashboard) showing every consultant’s available hours for the next 12 weeks (you can filter by manager, by people with more than X hours available, etc.)
-
- A project summary report, showing forecasted hours for each project for the next 12 weeks
-
- An accuracy report, showing the forcasted hours and the hours actually billed, per consultant, for the previous 12 weeks
-
- Reports showing who is delinquent in submitting their forecasts
-
- Etc.
Additionally, we have custom CW SQL views where we combine information from the forecast system with project reporting information (e.g., a report showing all relevant project stats plus a rolling 30-day forecast of hours and associated revenue for that project).
While developing the system took a fair amount of effort, and while we make tweaks on a regular basis, it has certainly helped us achieve a much greater level of visibility into our forecasted utilization and allowed us to make considerable improvements in terms of how we plan for and staff projects.
Comments, questions and suggestions are welcome.
jtf

